
ELK stack in practice
Using ELK to measure application performance.
ELK is an open source product that consists of three independent products, Elasticsearch, Logstash and Kibana.
Elasticsearch
The core system, basically a JSON Document store with a rest API. Using the API we can load data, calculate aggregations etc. Elasticsearch automates data indexing, persistance, redundancy etc. It is also spreading the data on multiple nodes achieving speed and reliability. It is used on large scale applications like github, bloomberg, stack overflow and wikipedia.
Logstash
It is a tool used to parse, filter and injest data to targets like elasticsearch. Source data can be simply a log file like the apache's access log file on the example below.
Kibana
It is a web application used to query and visualize data from an elasticsearch instance.
We can use Ansible -of course- to setup the full stack along with java and nginx as reverse proxy. Take a look at the article below on how you can do it. You may need multiple nodes of elasticsearch installation so a "configuration management" solution for installation and configuration is more than appreciated.
Deploying the ELK Stack with Ansible the Hard Way
A practical usage example
Imagine an apache web server in front of multiple application servers that are serving multiple applications. It is critical in order to measure user experience to log the response time (how much time needed to serve a response) of every request reaches the web server. You can do this by configuring the apache LogFormat parameter like this:
LogFormat "%{REMOTE_ADDRESS}e %t \"%r\" %>s %b \"%{Referer}i\" \"%{User-Agent}i\"  \"%{Content-Type}o\" %{ms}T" combined
 CustomLog /var/log/apache2/access_log combined
This will log the response time in milliseconds of every request at the end of every line. We can use it to analyse performance of any web application.
Parsing the data with Logstash
For the purpose of this example we created a nfs export on the apache server for the log file directory and a mount on our ELK server on /logs/ path. Then we used the following logstash configuration to parse access_log and injest the data to elasticsearch:
/etc/logstash/conf.d/apache_logstash.conf
input {
  file {
    path => ["/logs/access_log"]
    start_position => "beginning"
  }
}

filter {
  grok {
    match => {
      "message" => "(?:%{IPORHOST:clientip}|-) %{USER:ident} %{USER:auth} \[%{HTTPDATE:timestamp}\] \"%{WORD:verb} %{NOTSPACE:request} HTTP/%{NUMBER:httpversion}\" %{NUMBER:response} (?:%{NUMBER:bytes}|-) %{GREEDYDATA:junk} %{GREEDYDATA:responsetime}"
    }
  }

  grok {
    match => ["request", "/(?<context>[^/]+)"]
  }

  if "_grokparsefailure" in [tags] {
    drop { }
  }

  date {
    match => [ "timestamp", "dd/MMM/YYYY:HH:mm:ss Z" ]
    locale => gr
  }

  useragent {
    source => "agent"
    target => "useragent"
  }

  mutate {
    convert => {
      "response" => "integer"
      "bytes" => "integer"
      "responsetime" => "integer"
    }
  }
}

output {
  elasticsearch {
    template => "/etc/logstash/apache_template.json"
    template_name => "apache_elastic_example"
    template_overwrite => true
  }
}
As you can see the configuration has three different parts: input, filter and output. On the "filter" part we are matching every access_log line and we separate any field of it like the clientip, the context and the response time. We are also dropping any line that is not matching with our filter.
Now, starting logstash service, we can parse log lines like this:
...and store it to elasticsearch as this JSON document:
"_index": "logstash-2017.03.24",
"_type": "logs",
"_id": "AVsATvZDbW7v2O_waG6L",
"_score": null,
"_source": {
"request": "/eSales/scripts/jquery.blockUI.js",
"auth": "-",
"ident": "-",
"verb": "GET",
"message": "192.168.8.12 [24/Mar/2017:14:33:46 +0200] \"GET /eSales/scripts/jquery.blockUI.js HTTP/1.1\" 200 6579 \"http://web-server.example.com/eSales/?wicket:interface=:69::::\" \"Mozilla/4.0 (compatible; MSIE 8.0; Windows NT 6.1; WOW64; Trident/4.0; SLCC2; .NET CLR 2.0.50727; .NET CLR 3.5.30729; .NET CLR 3.0.30729; .NET4.0C; .NET4.0E)\" \"application/javascript\" 3",
"path": "/logs/access_log",
"@timestamp": "2017-03-24T12:33:46.000Z",
"response": 200,
"bytes": 6579,
"clientip": "192.168.8.12",
"@version": "1",
"host": "ELK",
"context": "eSales",
"junk": "\"http://web-sever.example.com/eSales/?wicket:interface=:69::::\" \"Mozilla/4.0 (compatible; MSIE 8.0; Windows NT 6.1; WOW64; Trident/4.0; SLCC2; .NET CLR 2.0.50727; .NET CLR 3.5.30729; .NET CLR 3.0.30729; .NET4.0C; .NET4.0E)\" \"application/javascript\"",
"responsetime": 3,
"httpversion": "1.1",
"timestamp": "24/Mar/2017:14:33:46 +0200"
},
"fields": {
"@timestamp": [
1490358826000
]
},
"sort": [
1490358826000
]
}
Visualize it
Our data is stored and indexed so we can run some interesting visuals in Kibana.
At first lets find out the slowest applications (say the contexts ordered by response times).
In kibana:
Visualise > New > Vertical bar chart
We created here a vertical bar chart with two metrics (average response time, max response time) for every context, sorted by average response time:
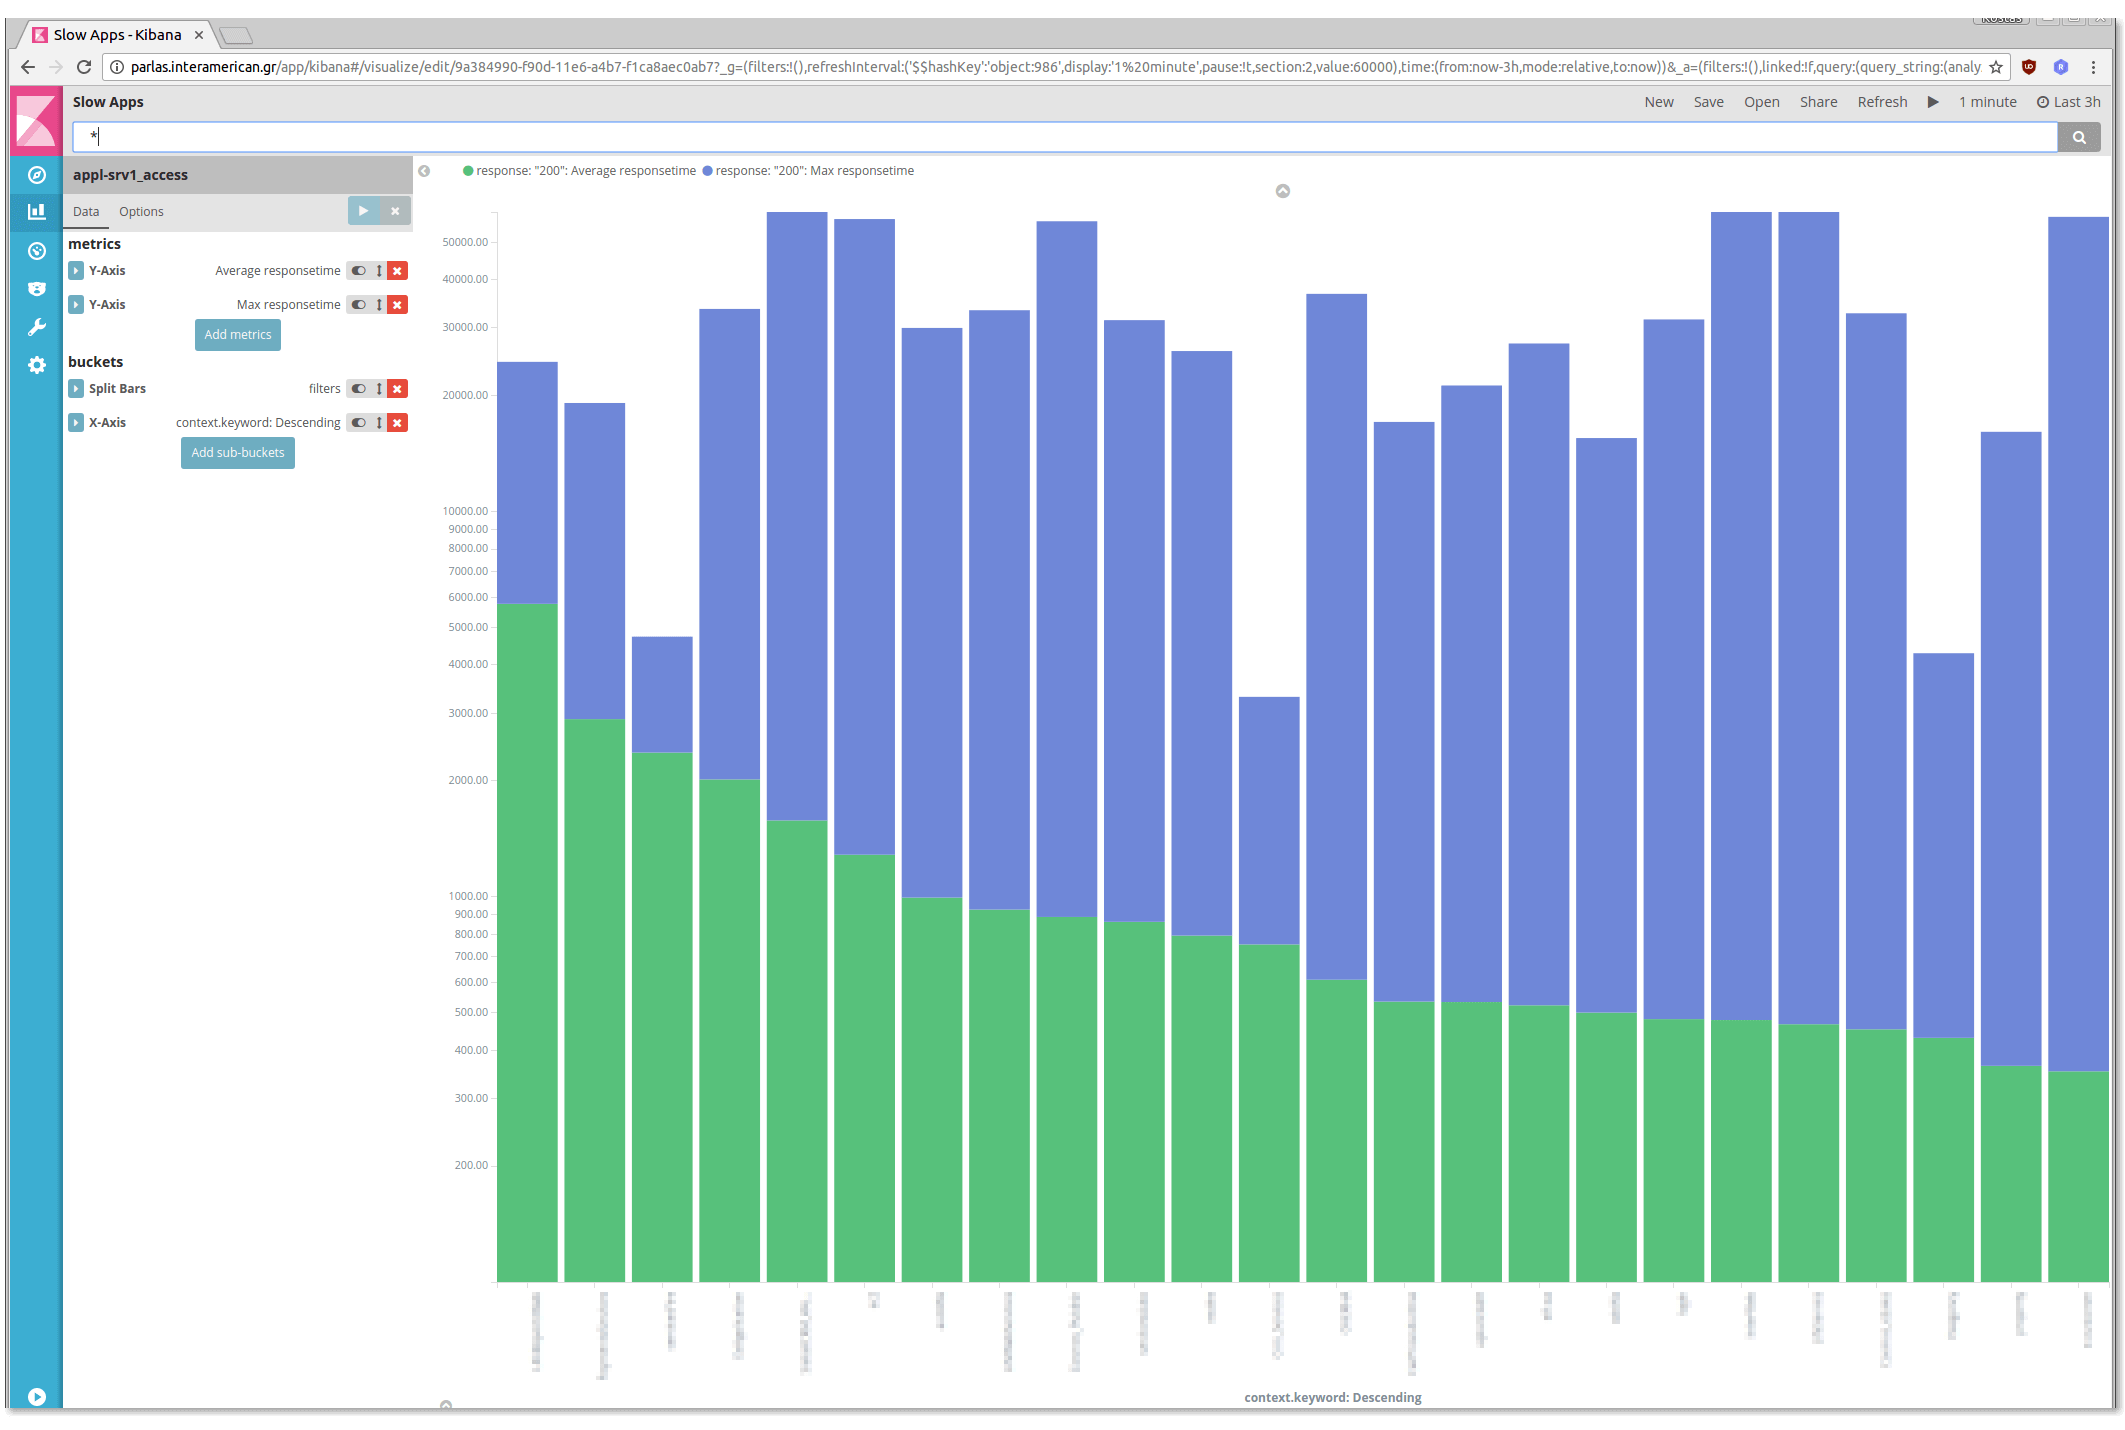
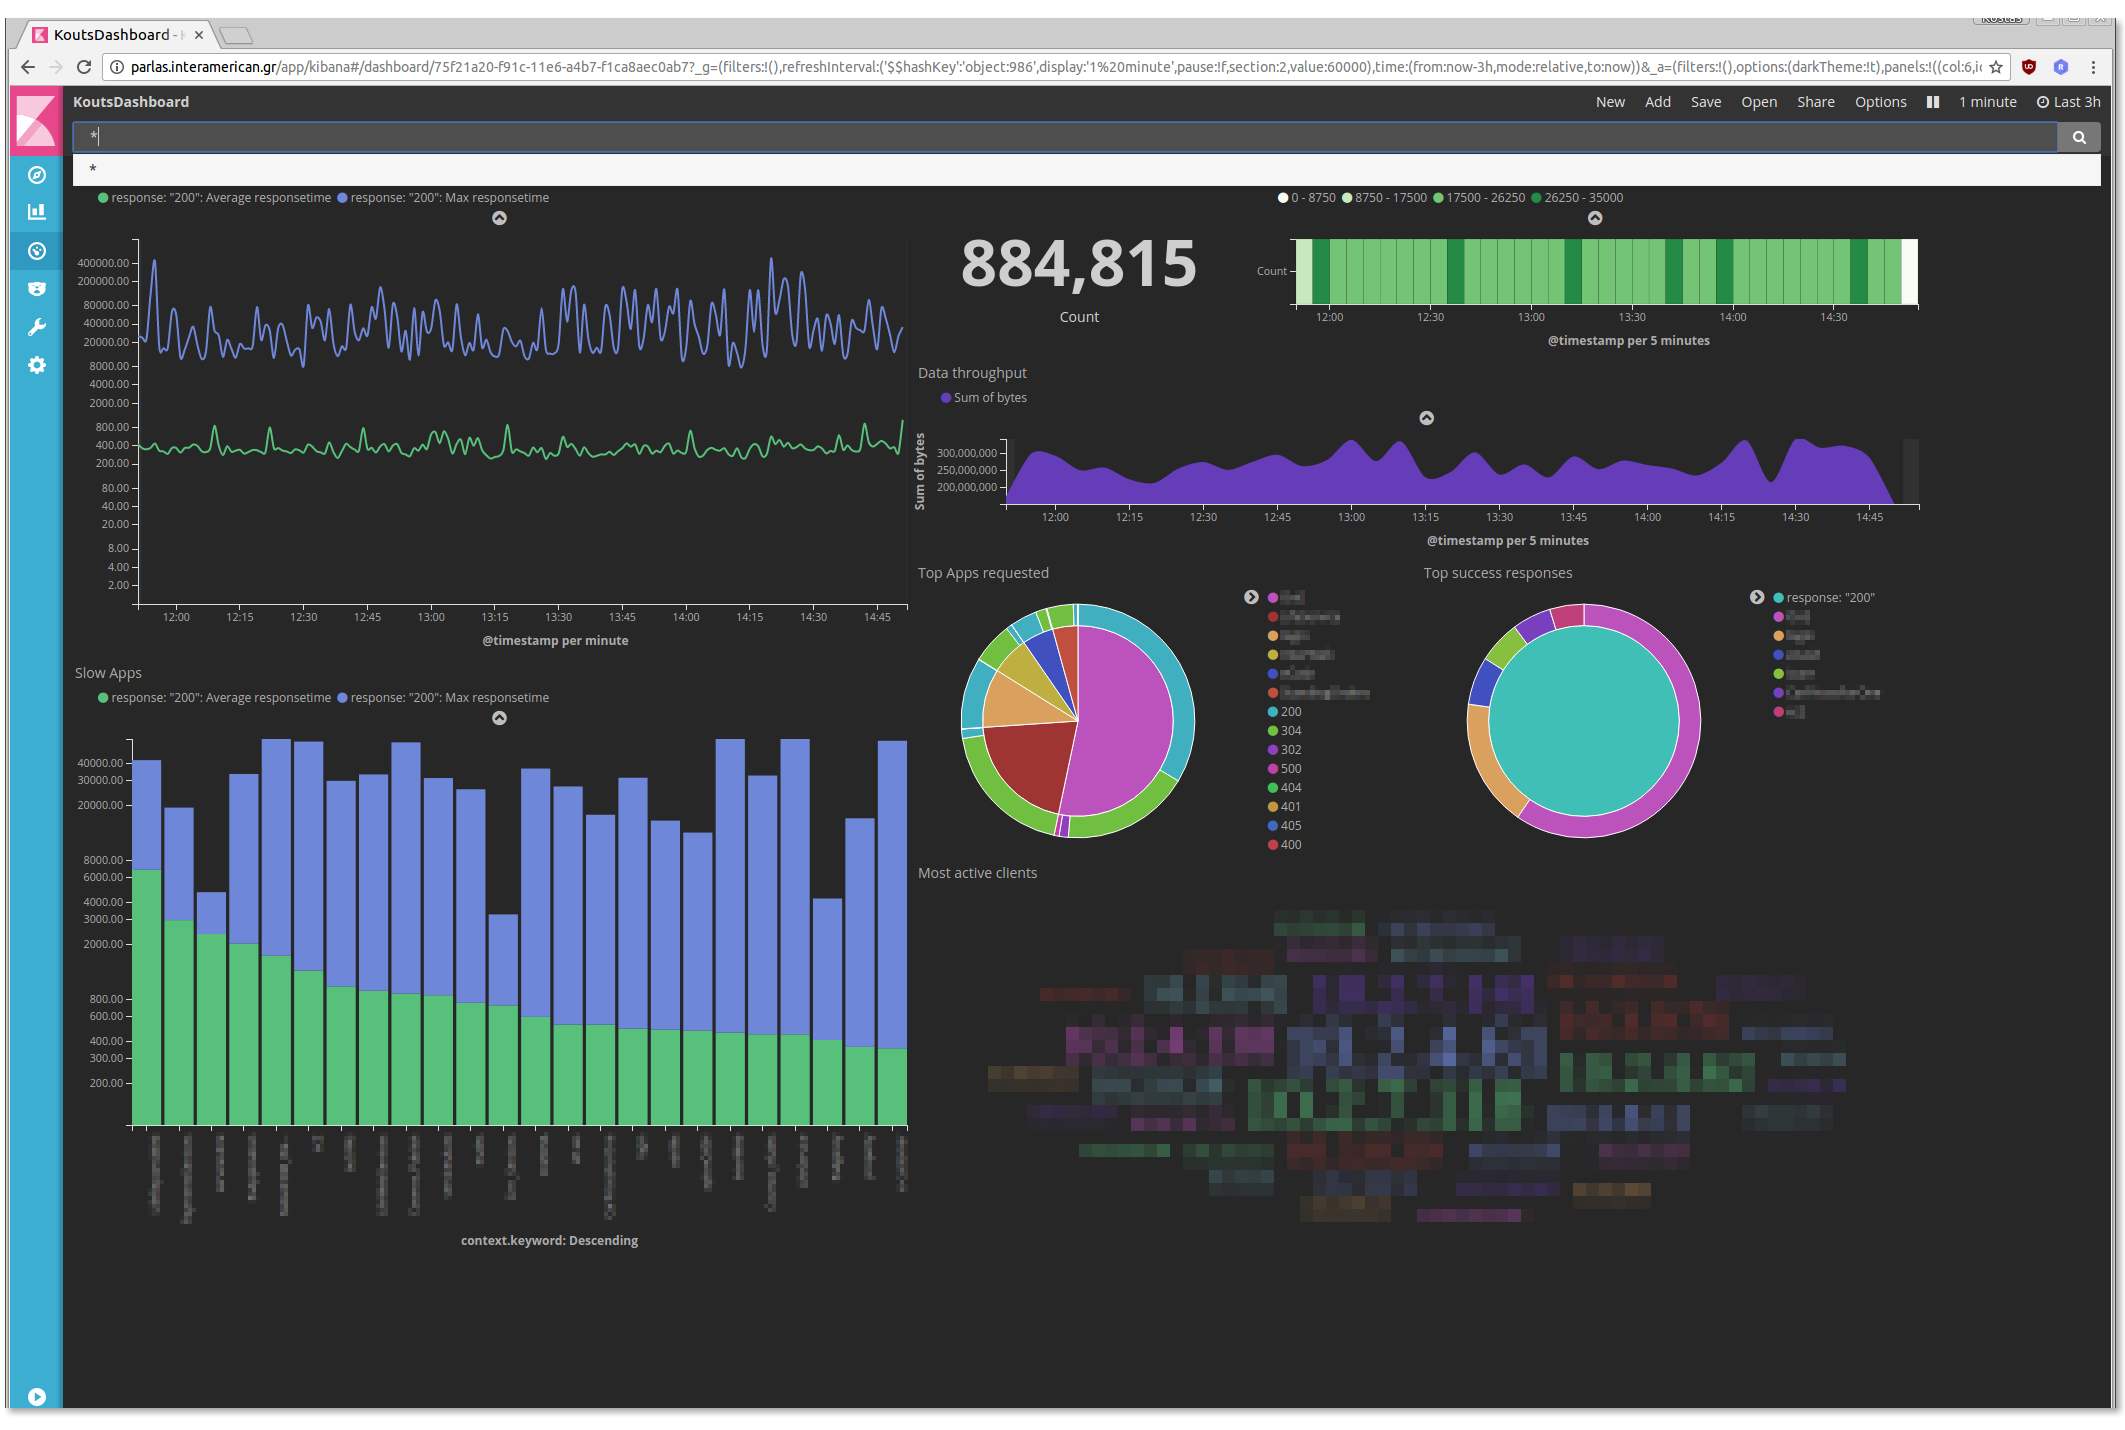
We can save this visual, create some more and collect them on a dashboard.
In kibana:
Dashboard > New > Add > <Select some of your saved visuals>
You can create a proper dashboard to be shown on a big screen (dont forget to activate auto refresh):
 <
<
But this is only one of the functionalities.
Filtering - dig in
Any click on a visual in the dashboard is equivalent to a filter creation. For example lets click on an application of our "Slow Apps" chart, the "eSales" application:

Click on the "Apply Now" button and watch the dashboard beeing adapted to the new filter:
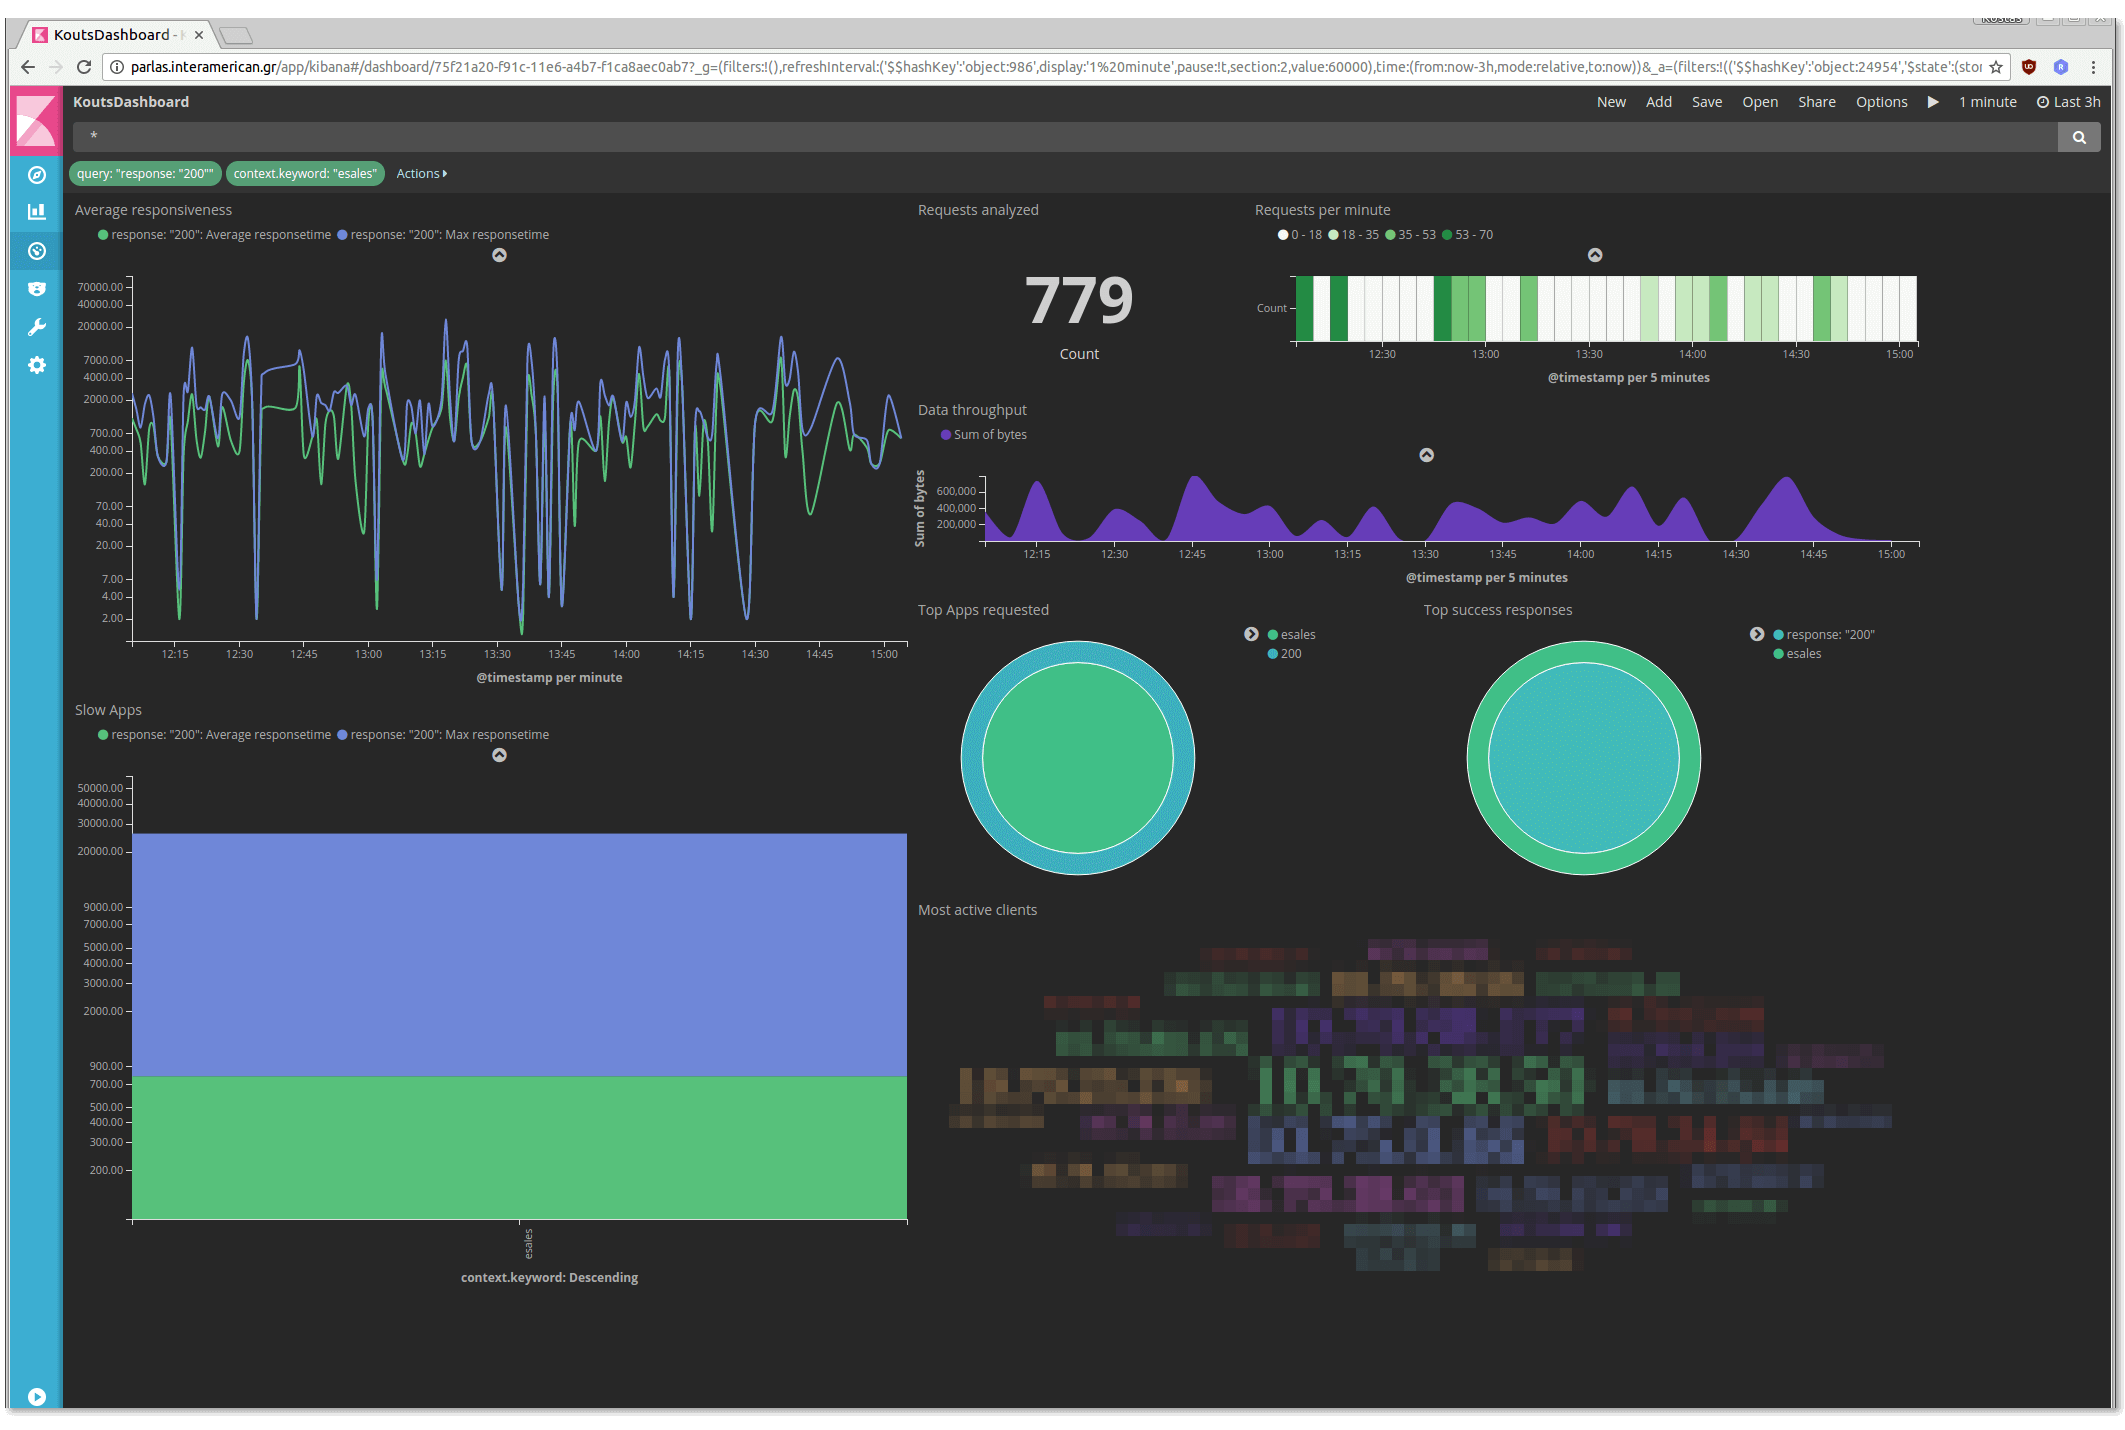
Obviously, next time a user call you to say that some application is "crawling", you will have a handy tool to confirm it.
- Posted by Kostas Koutsogiannopoulos · March 27, 2017

